WESM Market Analytics & Predictive Forecasting Engine
Formulated advanced, rounded DAX measures and engineered a production-grade 3-page business intelligence engine to optimize power market exposure, manage grid capacity factors, and minimize financial setbacks.

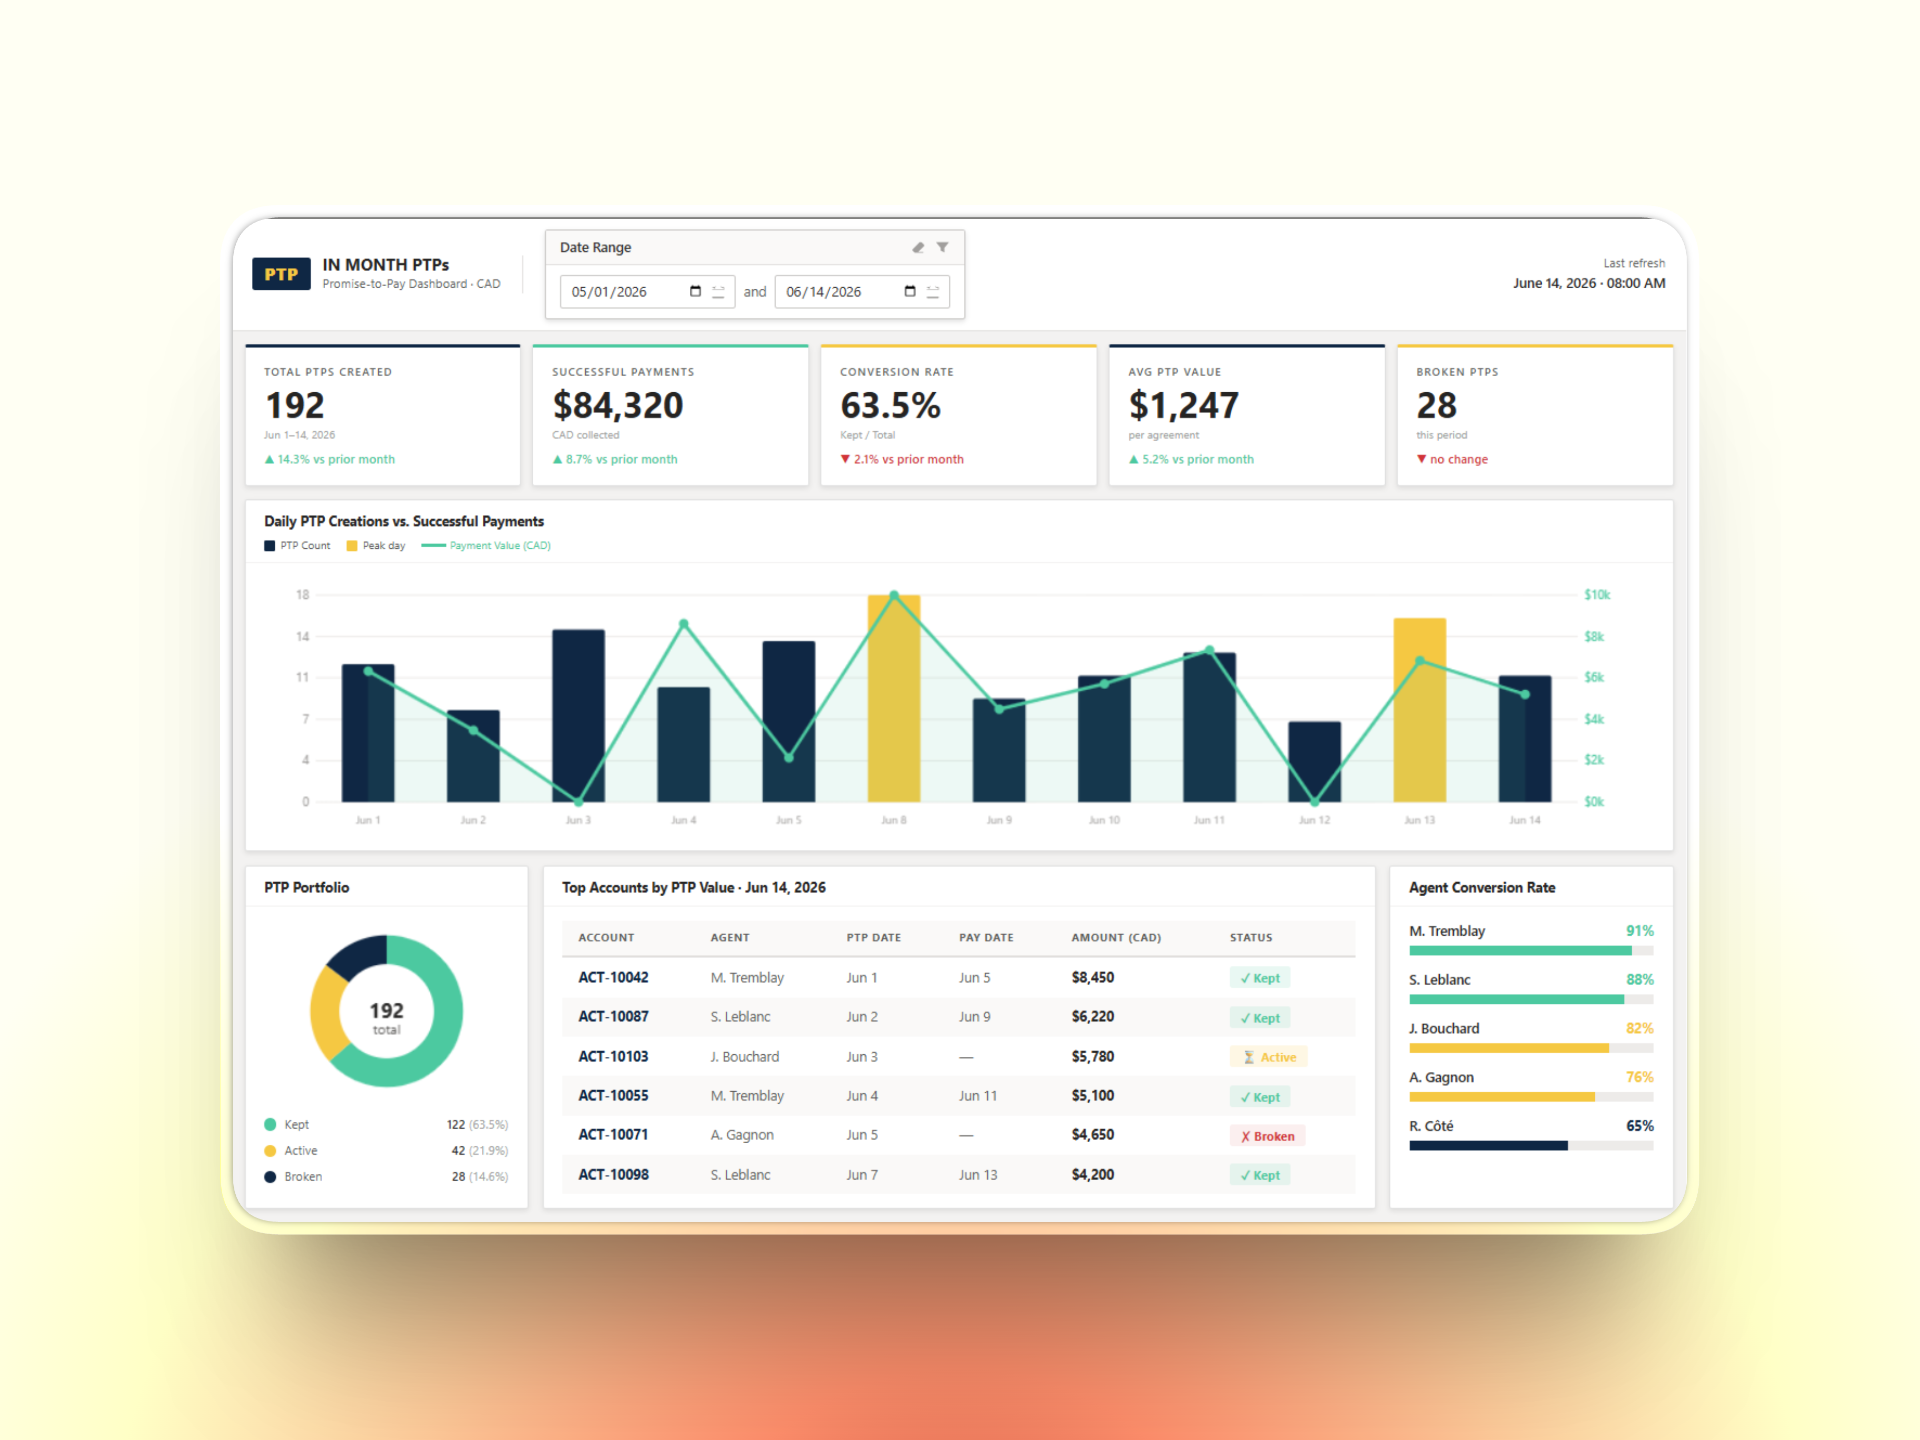
Operations Summary
Dual-axis price bars (normal vs. setback) overlaying MQ & BCQ tracking lines. Executive KPI blocks (Net Exposure, Peak/Off-Peak Price, LCF), multi-tier date slicers, and generation portfolio splits across PSALM, GNPK, TSI, FDC, MPI, SEC.
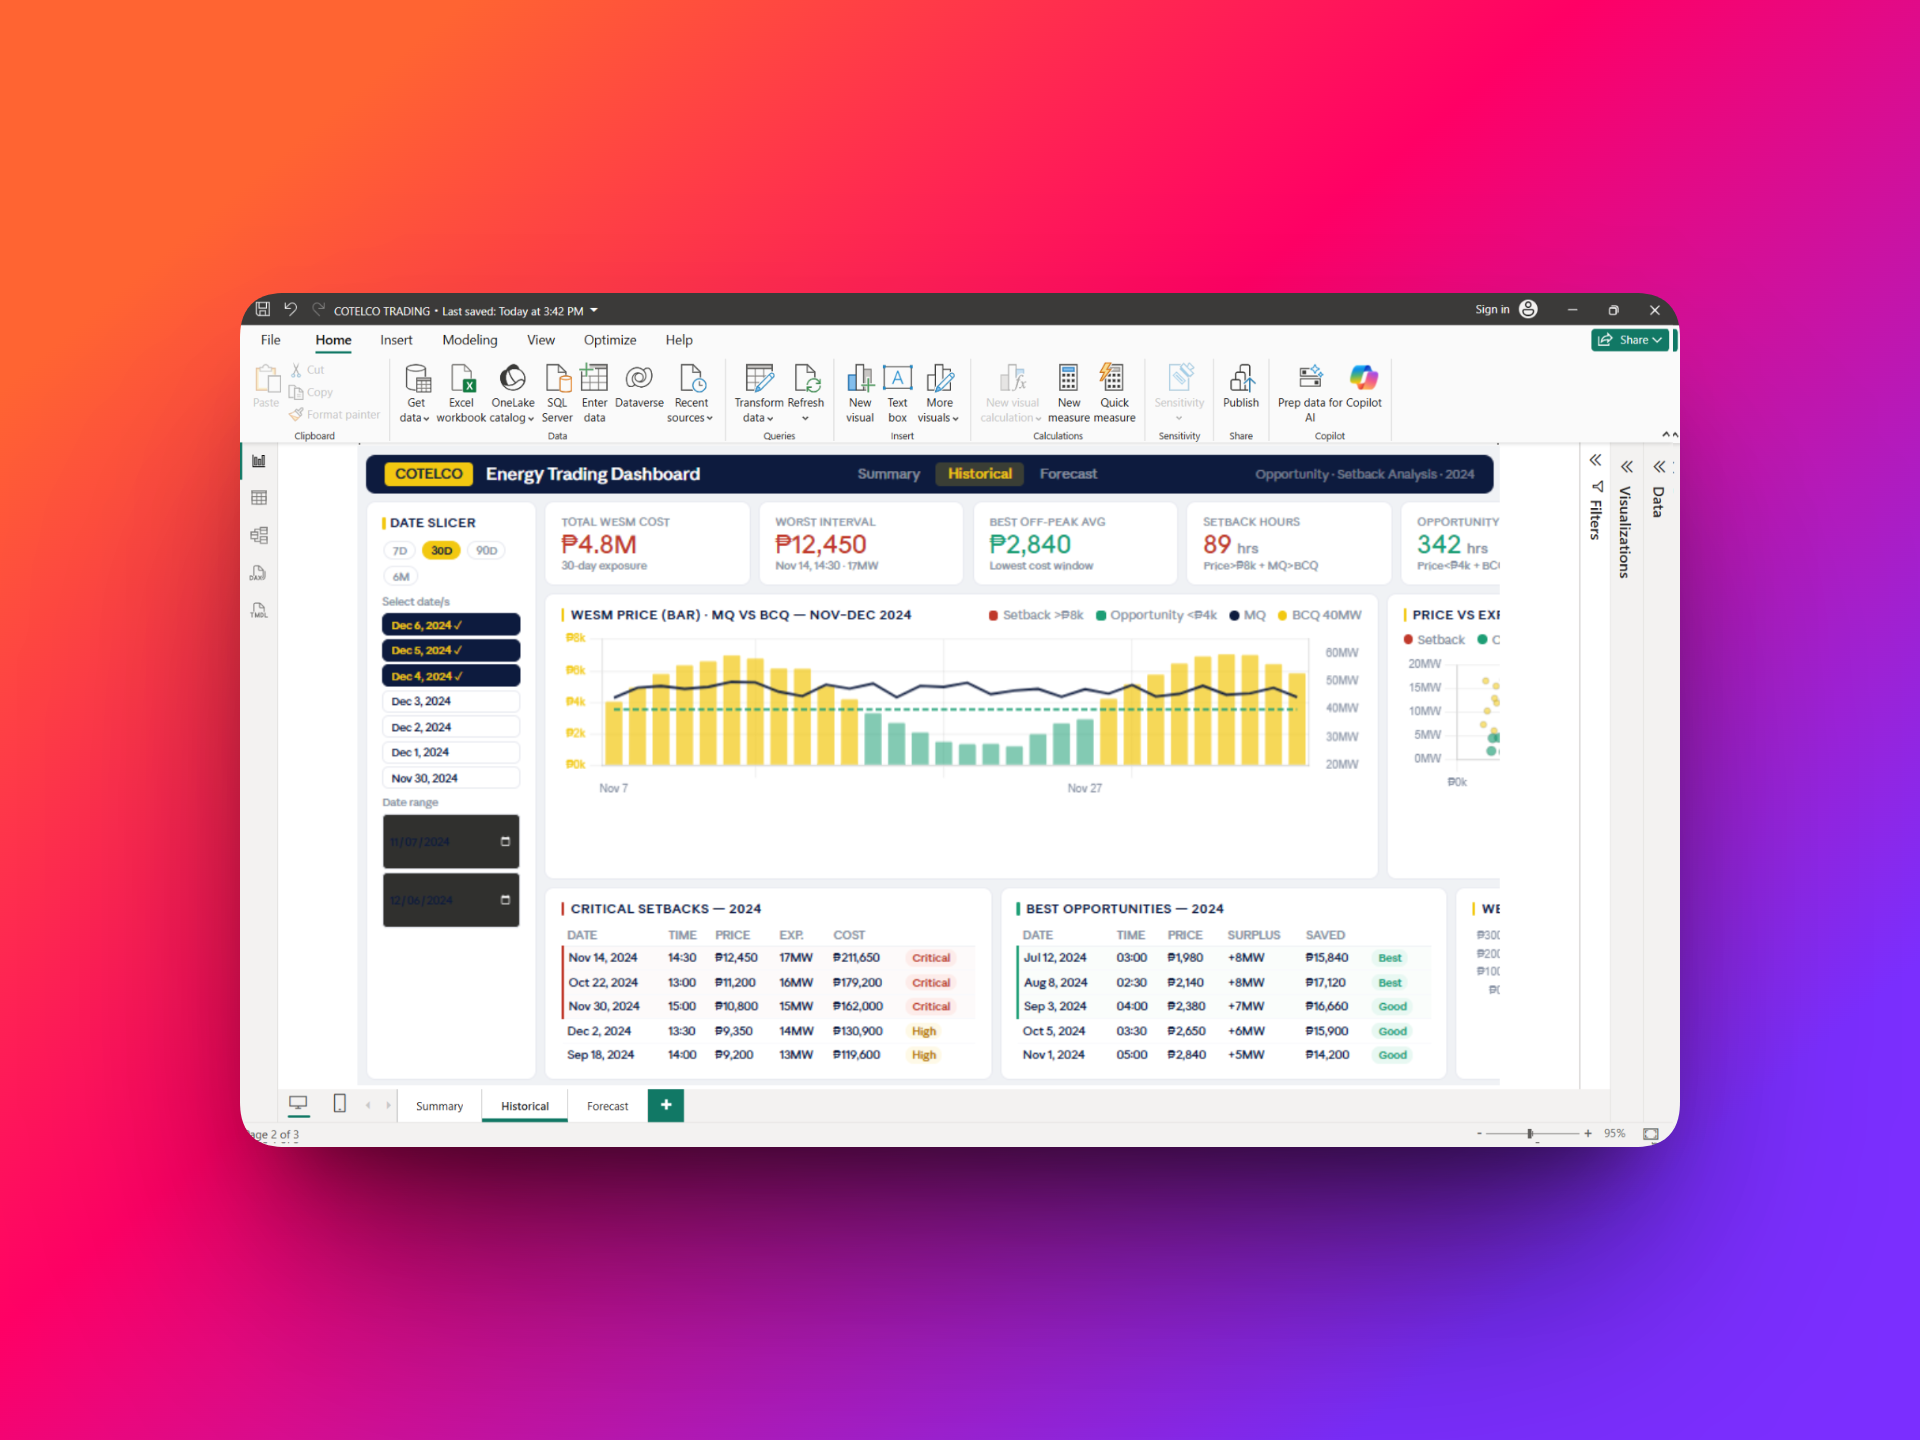
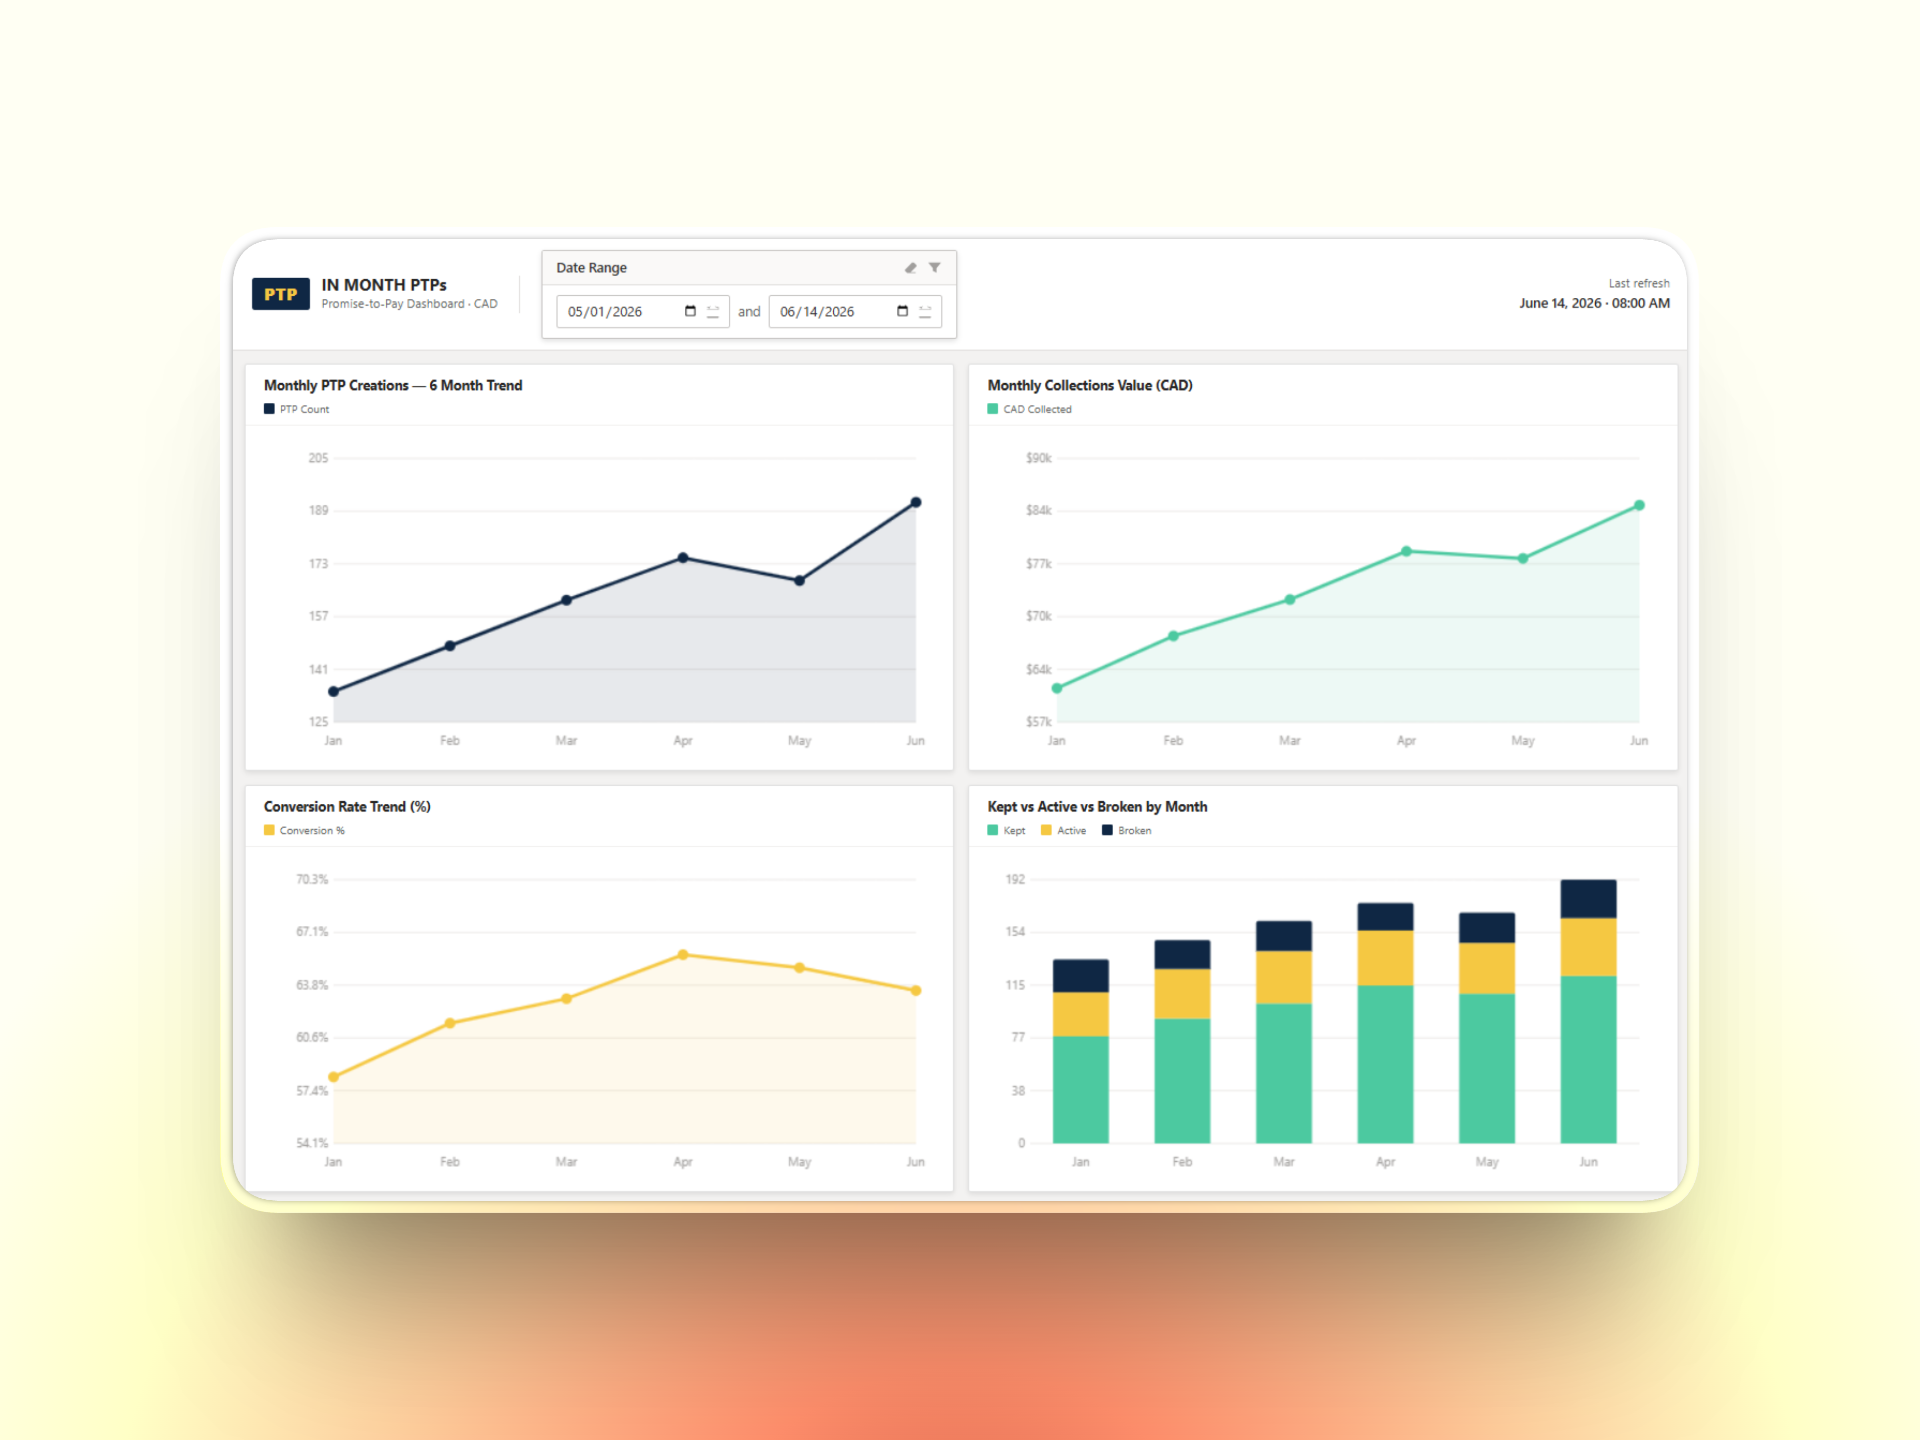
Historical Audit & Variance
Multi-month time-horizon filtering. Tracks total WESM costs, worst intervals, and daily metrics with conditional bars isolating severe setbacks (>₱8k) and opportunities (<₱4k) against flat contract baselines, plus Price vs. Exposure scatter plots.
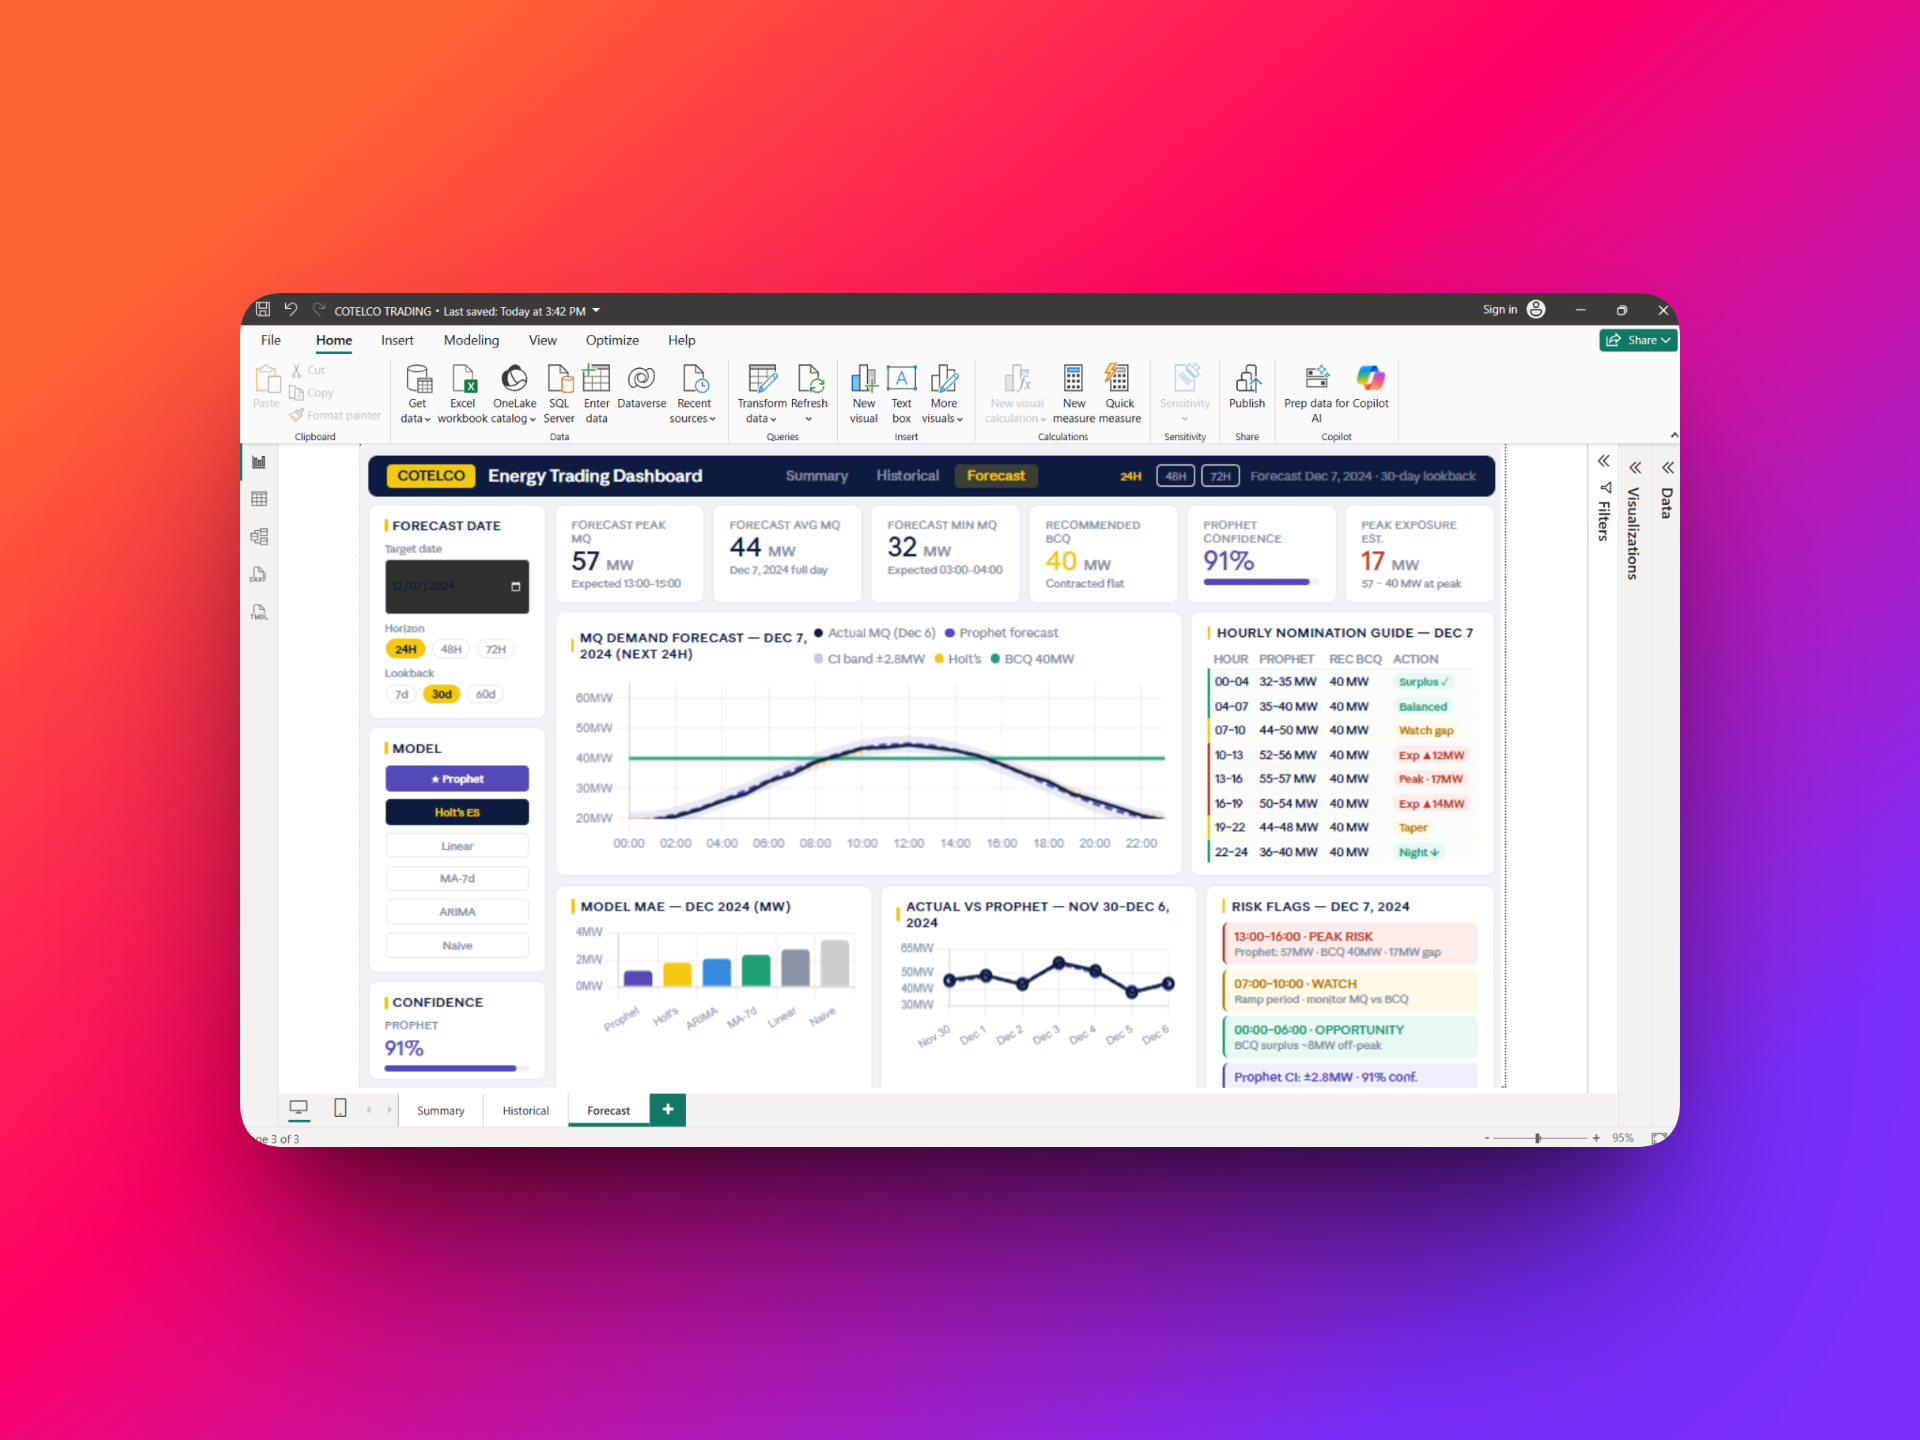
Predictive Load Forecasting
ML forecasting interface using Facebook Prophet and Holt's Exponential Smoothing. Visualizes actual MQ demand against ±2.8MW confidence bands vs. flat contracts, feeding an automated Hourly Nomination Guide with dynamic action flags.